🌻 Sentiment – Which changes are perceived as most positive or negative ?
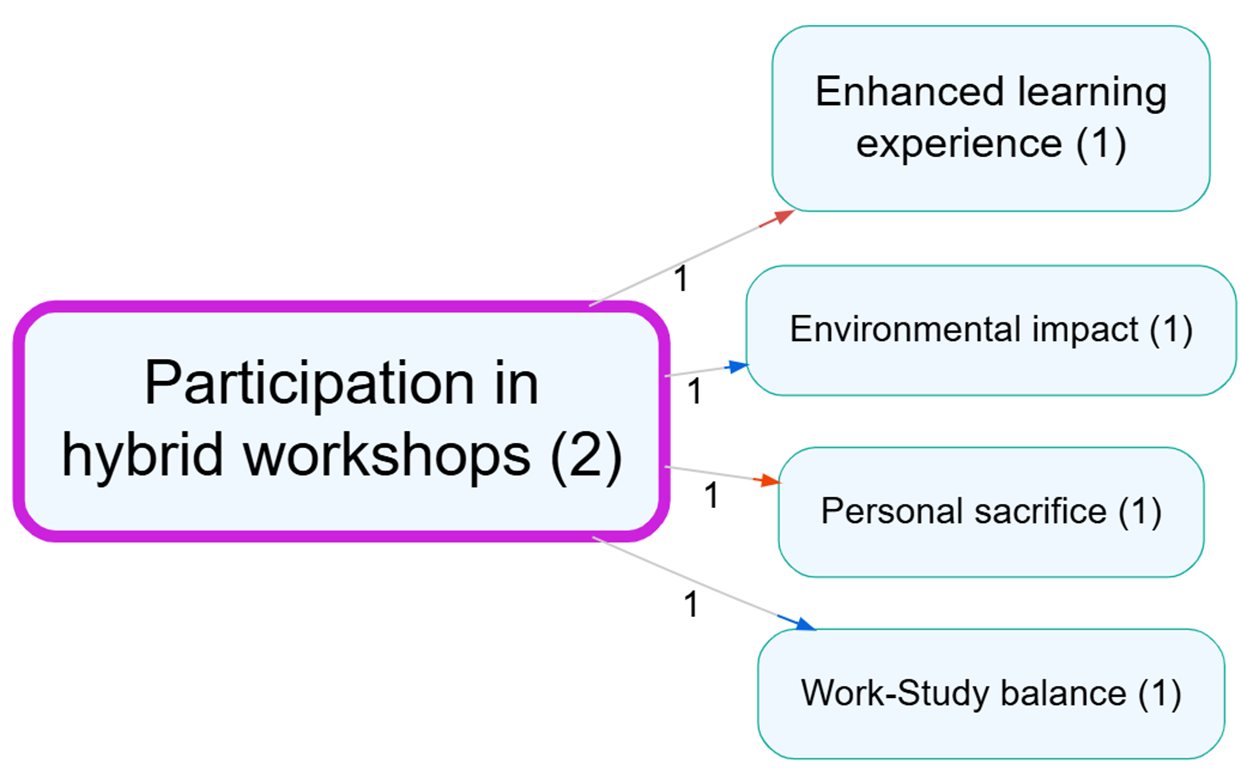
- Analysing the sentiment expressed by your respondents and displaying it on your maps using positive (blue), negative (red) and ambivalent (grey) enables readers to easily identify positive and negative connections.
- This visual representation can quickly highlight areas of success and potential improvement.
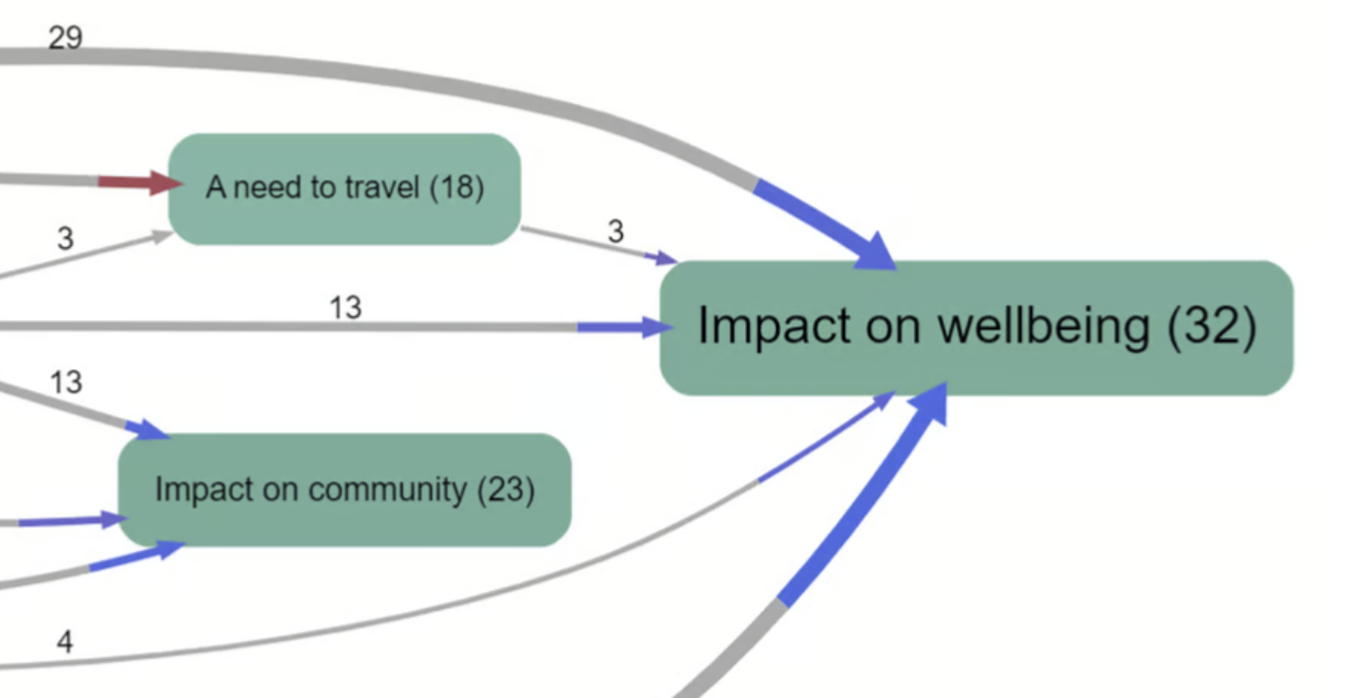
Building on the previous example, you can analyse the sentiment in particular of the immediate impacts of your project or intervention.